Statistical Process Control (SPC) is the use of inspection data to determine the characteristics of a process, using techniques to find and remove abnormal variations in completed tubes. Variable data is quantitative and is generated from actual measurements, such as the Mismatch, Bead Height, Deflection or similar measurements obtained from the Xiris WI2000 Weld Inspection system when it is placed right after the weld box on a tube mill.
Variation is the difference between things that should be alike because they were produced under the same conditions. Variation can be measured and groups of these measurements can be plotted as a frequency distribution, or histogram. Since quality is a measure of conformance to specifications, poor quality results when variation falls outside the upper and lower specification limits.
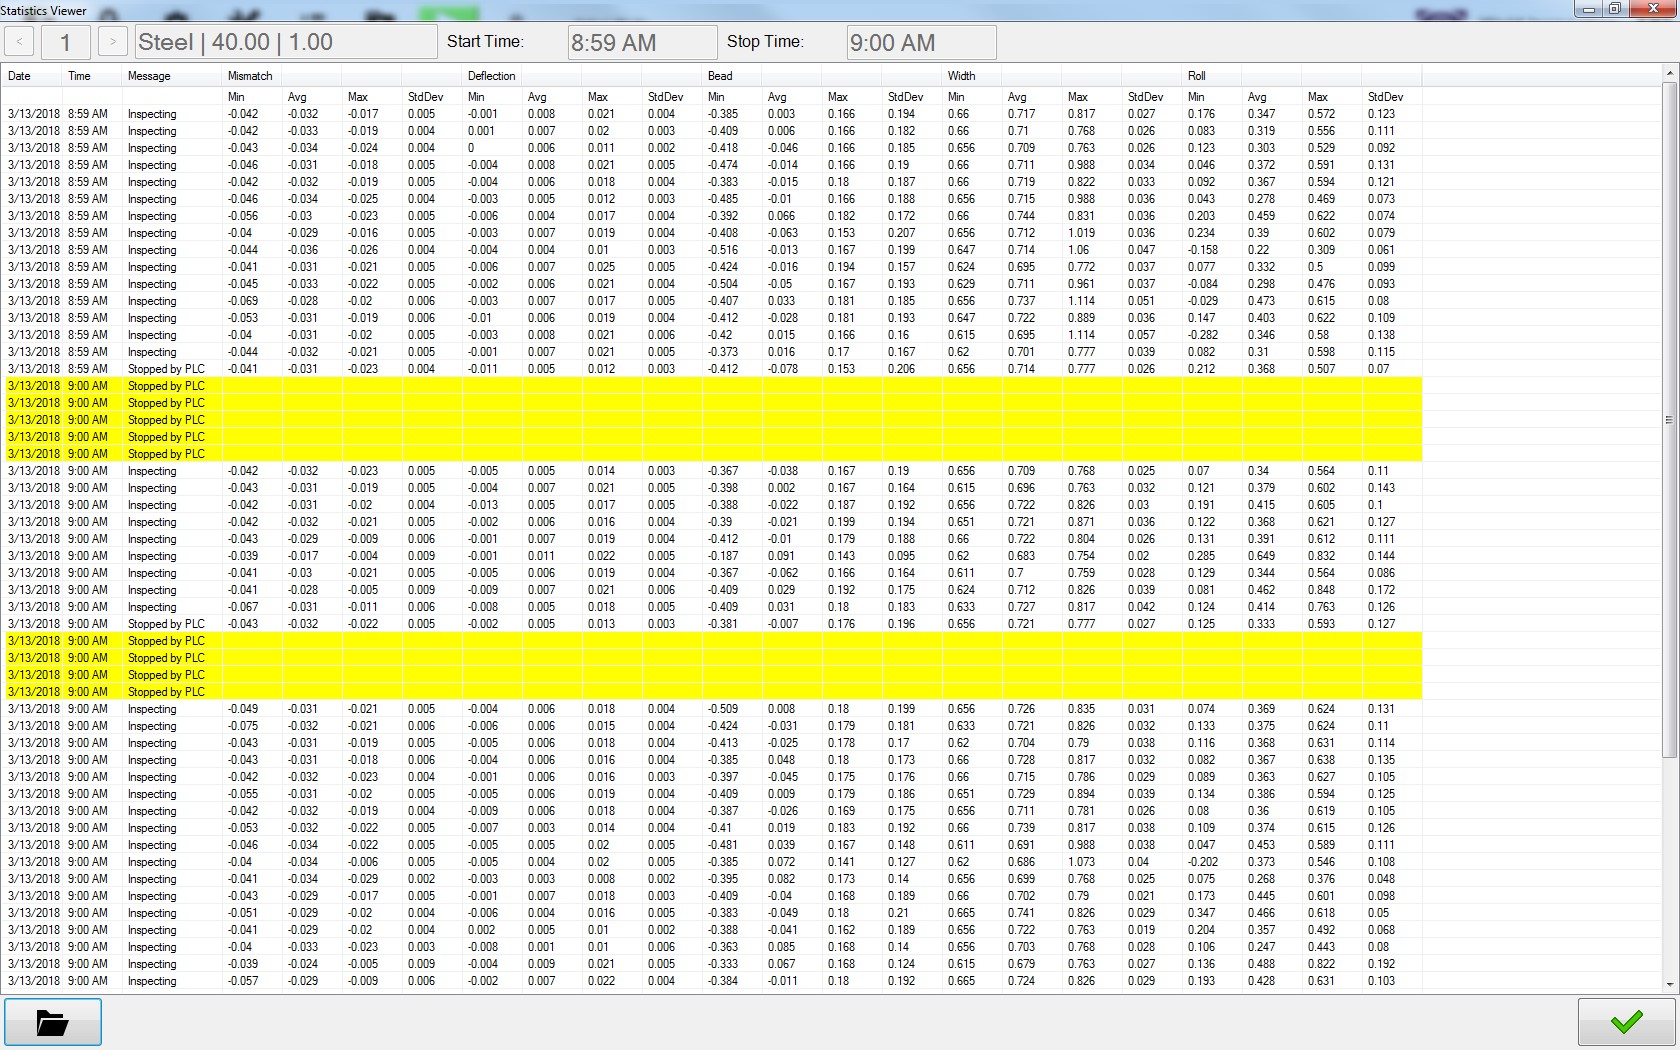
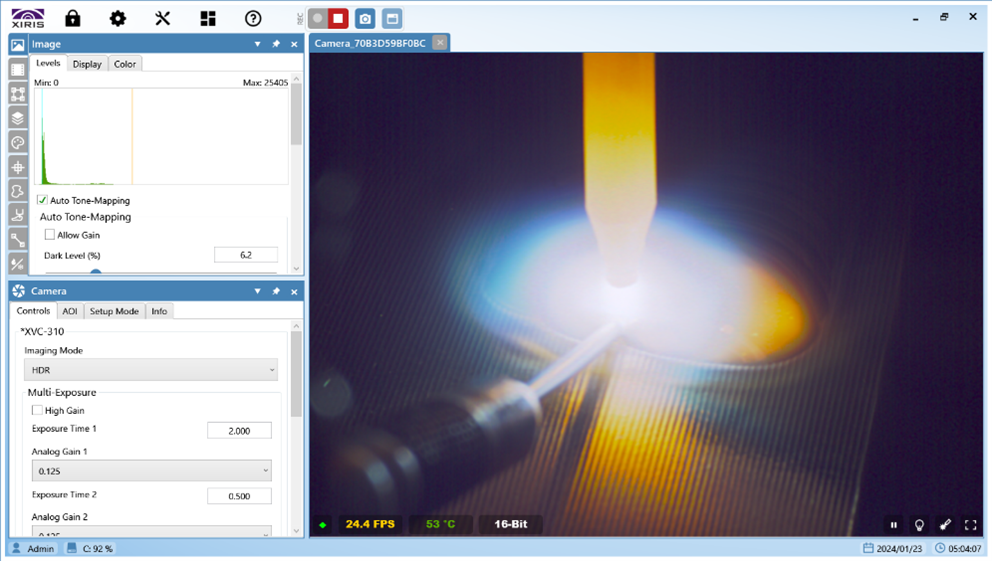
The SPC Data Logging Utility Display from a Xiris WI2000 system
SPC data can now be recorded and reviewed off line using the WI2000 measuring a number of parameters, including:
- Mean - the average of a group of values of a particular measurement.
- Median - the middle value of a group of ordered measurements.
- Mode - the measurement occurring with the highest frequency. This is the peak of the histogram. In a true normal distribution, the mean, median and mode are all equal.
- Range - the highest minus the lowest value in a set of measurement data. This is a simple measure of the dispersion, or spread, in a set of data.
- Standard Deviation - a measure of dispersion computed from the square root of the sum of the deviations from the mean, divided by the total frequency.
Statistical process control uses the concept of subgroup sampling. This is a method of data collection that considers a series of consecutive measurements together as a single group. A typical subgroup size is five (5) measurements. In order to smooth out the variability associated with an individual measurement, five consecutive measurements would be considered together as a representative sample.
Xiris has implemented an SPC measurement logging capability to provide a way for fabricators to monitor their tube mills and identify abnormal variations in their completed tubes.