Welding is typically a monochrome process, where the parent material to be welded, the wire, the arc and torch are usually predominantly grey with very little color components in the image.
Some exceptions do exist however, such as GTAW / TIG or Plasma welding, where some color does exist, especially of the welding torch.
In such cases, a color camera may be a preferred choice to image the process to allow the operator the ability to see some features that are not as easy to see with black and white imaging.
 Fig. 1: An Original RAW Color Image of a GTAW Process
|
With a typical weld camera system such as that provided by Xiris, images are generated by a color camera in a raw image format that can have up to 20 bits per pixel. These images must then go through a tone mapping process to achieve the best quality of image for display on monitors that are typically 8 bits per pixel.
This process of tone mapping is critical to enhancing color images so that they can be of the most interest to the viewer. Every welder prefers to see that their own specific features get enhanced by the tone mapping process so that they can be most visible and allow them to make better decisions about their process. The way the tone mapping process is set up can define which features in a weld image are enhanced for the viewer. Certain features can be made more visible by changing the imaging parameters of the tone mapping.

Features such as the leading edge of the melt pool, the seam width and position, the presence of the Heat Affected Zone (HAZ) and the texture of the melt pool are all examples of features that can be enhanced by adjusting the tone mapping parameters.
Xiris has developed a powerful color imaging software module as part of its WeldStudio platform to allow the user to adjust the tone mapping parameters to ensure their features of interest are most visible. This is done through a series of steps:
- Firstly, the software looks at the histogram information of each colour channel. A digital color image is made up of three components – Red, Blue, and Green (or “RGB”). So, every pixel has its own unique value of Red, Blue, and Green. The Min and Max of the histogram is measured for each RGB component and a “valid range” of pixel intensity values is “cut” from the input range.
- The tone mapping software normalizes the colors for display such that the pixels at the bottom of the range are displayed as pure black, and those at the top of the range are pure white, with intermediate values mapped accordingly. The Black and White values can be automatically calculated by the software, or they or they can be manually controlled by the user. The calculation of the Black (bottom cut) point and the White (top cut) point is influenced by the Dark Level and Saturation settings, respectively.
- The mapping of the valid range to the output image is linear by default. However, it can be made non-linear using Gamma or S-Curve
- Reducing the Gamma will cause more detail to be visible in the dark areas of the image; increasing it will cause more detail to be visible in the bright areas.
The S-Curve is a form of Look Up Table (or “LUT”) that translates how each input RAW pixel will be displayed as part of the tone mapping process.

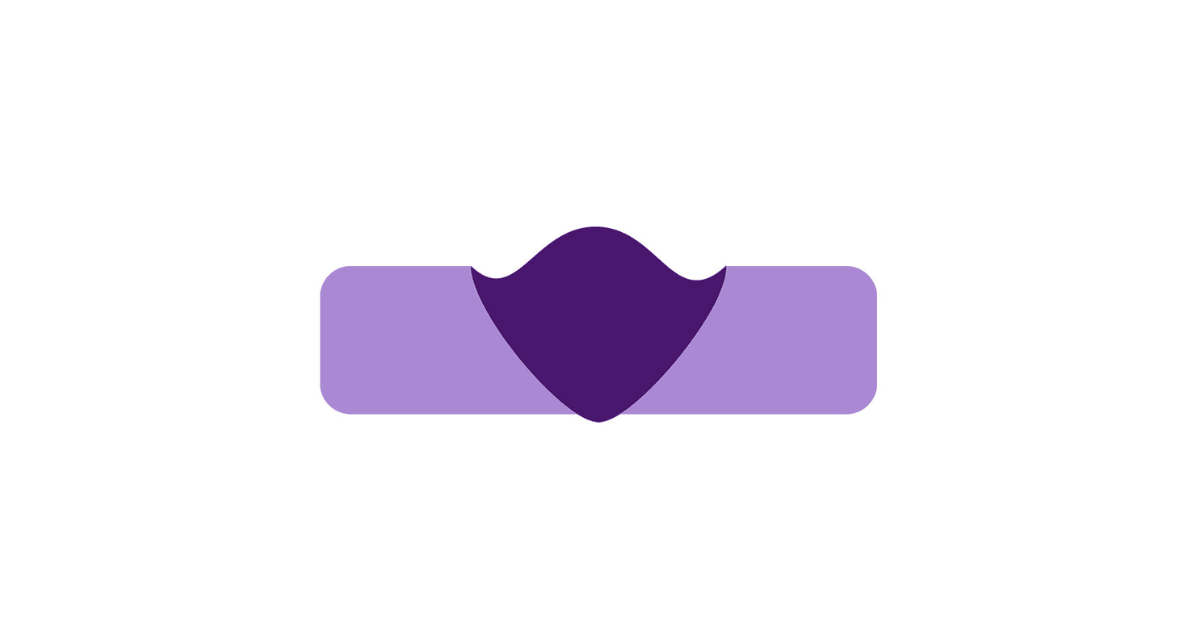
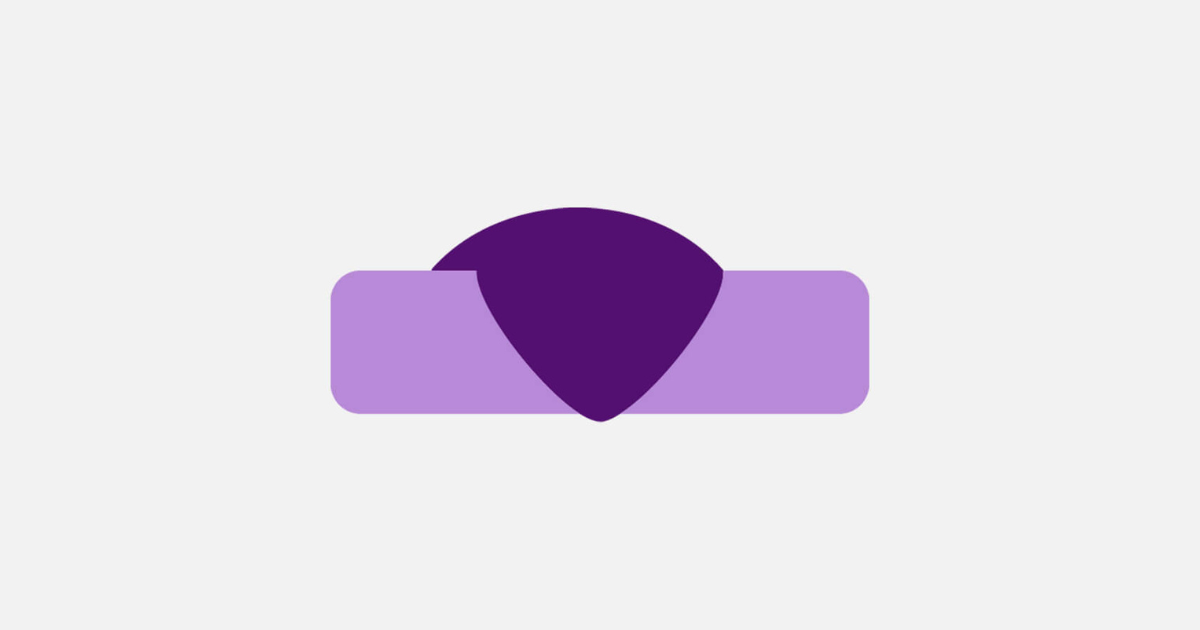
Fig 2: An S-Curve with associated controls used to change Tone Mapping |
The S-Curves are generated using an equation in the format:
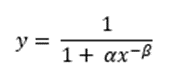
|
Where α and β are coefficient values that can be adjusted using sliders to change the shape of the S-Curve. In the case of color images, each R, G and B color channel can have its own curve. By adjusting the coefficients, the respective color component can be made brighter or darker, helping to enhance the image to highlight certain features.
Finally, the overall image Vibrancy can be adjusted to provide an increase in the intensity of muted colors often found in a welding process, while leaving saturated colors (such as the weld arc or torch) untouched. The result is that other weld features (such as melt pool or background) can appear more natural and even as the vibrancy is increased.
Examples with Different Tone Mapping
|
Figure 3. Original Raw Image. Note the dark background and good detail around the Arc.
|

Figure 4. Color Temperature Compensation turned on with Vibrance @ 30%, Tone Mapping S-Curve set with RGB coefficients of α=0.57, β=-0.24. The result is a much brighter background with good definition of weld seam edges. |

Figure 5. Color Temperature Compensation turned on with Vibrance @ 0%, Tone Mapping S-Curve set with RGB coefficients of α=0.57, β=-0.24. The result is an even brighter background with some saturation occurring in the weld arc and torch area. |

Figure 6. - Color Temperature Compensation turned on with Vibrance @ 30%, Tone Mapping S-Curve set with Red coefficients set at α=1.0, β=0.0 and Green and Blue coefficients set at α=0.57, β=-0.24. This produces a reddish hue over the entire image which appeals to some welders as they can see more clearly features such as the leading edge of the melt pool as there is a better contrast between the melt pool and the parent material. |
Summary
Color images can provide additional information to a welder that is not often noticed in a monochrome image, especially for precision welding such as GTAW / TIG. In some very specific welding processes, the enhancement of the Tone Mapping processing using individual Look Up Tables can be an effective tool to customize the display of an image and highlight specific features of interest to an individual welder.

|
Stay up to date by following us on social media or subscribe to our blog!
![]()
![]()
![]()
![]()